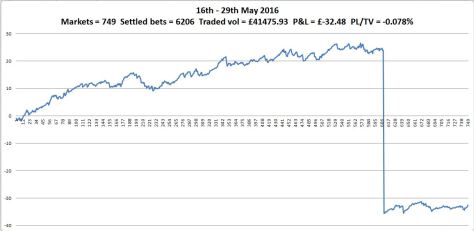
These charts cover a two week period. The obvious feature in the UK chart was reported here. It was a loss of £58.51 on a losing Lay bet placed in error. The interesting thing is that for the period, the overall return only amounts to -0.078% of turnover. As a single event, it takes the greyhounds “bank” back to where it was on the 29th April. It could be worse.
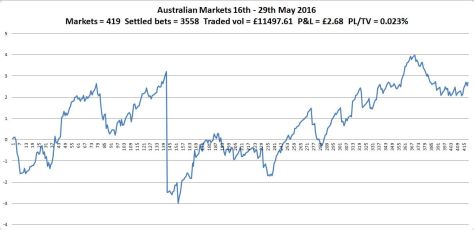
The Aus markets performed well generally. Again there is a, relatively, large loss. I hadn’t noticed this until I did the chart but after what happened on the greyhounds I thought I’d look into it. The events leading to the loss of £5.70 were identical to those above. The trend without this is good though.
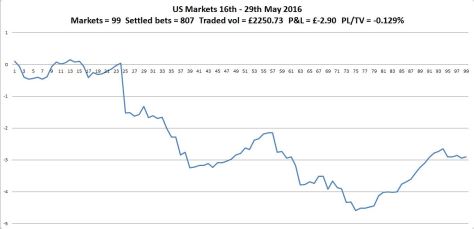
The US markets have not done too well but I am not giving up on them just yet. They haven’t traded since the loss on the dogs due to a minimum balance limit being different for the US, which I hadn’t noticed. I’m going to make some fine adjustments to the entry triggers before restarting.