Tag Archives: betfair

My bot data

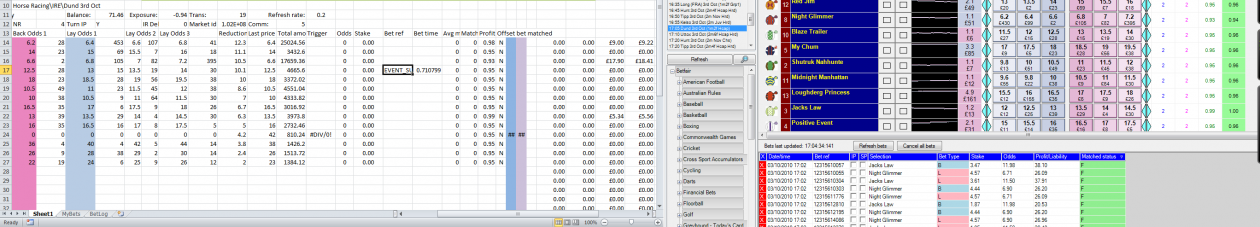
I was asked about my data here and here. This is the data I collect:-

MyDataExample

My bot collects data from each opening trade placed, attempted opening trade (unmatched) and when the market meets approx 90% criteria. The trigger includes a stoploss and tick-offset which are fired in response to the market so I don’t have any data relating to the point that they are placed.

I also record market suspension to help with analysis. I don’t record any other data about the market. If no trades are made in a market, I have no data.

The columns are as follows-

MyDataExample2

A = Market

B = Market ID

C = Time at last refresh

D = Seconds to off

E = Selection name

MyDataExample3

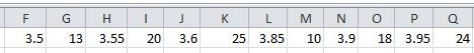
F thru Q = Best 3 back/lay prices (F,H,J,L,N,P) and volumes (G,I,K,M,O,Q)

MyDataExample4

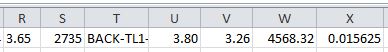
R = Last price matched

S = Total matched for this selection

T = Trigger

U = My requested price

V = My stake

W = Total matched for this market

X = Timer output (time it takes for my code to run using excel’s timer)

The problem with data is how much is available. I’ve tried recording whole markets but you soon end up with megabytes of data that means nothing without refining. You first need an idea of what you want to find and then go about collecting the relevant data. For instance, I only record the data for my selection, not the other runners. You may only need data for the last 3 minutes before off, or only in-play, depending on how you want to trade. You could record prices in the morning and then at the off to look for trends. Without knowing what you want to target, data on its own is not much use. Because my data is so specific to my bot, it wont be any use to others without knowing the algorithm that picked it out.

EDIT:- below is a file of data recorded from one race. As Gruss passes the market to excel, I recorded each refresh to a sheet for each race. I only did it for a few days due to the size of the files. It’s about 280KB and taken from a day file which was 150MB in size.

recorded-data-to-share1


Week ending 03-07-16

Here are last weeks charts. Both performed well overall with similar mid week dips. The ratios are above average for both markets.

I’m going to leave the stakes as they are for now, having reduced them after previous losses. they are still a percentage of bank so will increase (or decrease) with balance.

Also, no US racing for now until I’m happy with dogs and Aus.

On a different note, these charts were produced automatically using VBA. The data is saved from Betfair in two files for each market and I’d been manually sorting, calculating and creating the chart. After a few hours learning some new techniques, I can download the P&L and History files, open the P&L and run a macro. Less than a second later and the chart is created, exported and saved in a separate file, ready for the blog. I really like automation .

160703


Aus160703

Weeks ending 26-06-16

My time is a bit limited with our new arrival (revealed here), which is why it’s been a month since my last results.

As I wasn’t keeping an eye on the bot, it went on a losing streak, hitting the minBalance level and stopped trading. Due to a coding error created after the previous error, Aus trading was also interrupted. After about a week of no trading, I finally noticed and restarted the Aus markets but left the  UK and US paused until I could look into any cause.

Having looked through all my data I can’t find any reason for the losses beyond “that’s what happens, win some, lose some”. Downward trends are to be expected as much as upward trends in the short term. I restarted the UK markets with reduced stakes at the beginning of the week. Time will tell.

160610

The trading that the Aus markets produced was below recent returns but positive.

Aus160623

I know why the US markets stopped trading before the others, the minBalance is set different and is auto adjusted periodically. However, this only auto adjusted upwards and didn’t cope with a loss just after adjustment – there wasn’t enough room to allow for regular losses and another error meant excel hit a run time error.

US160605

Weeks ending 29-05-16

These charts cover a two week period. The obvious feature in the UK chart was reported here. It was a loss of £58.51 on a losing Lay bet placed in error. The interesting thing is that for the period, the overall return only amounts to -0.078% of turnover. As a single event, it takes the greyhounds “bank” back to where it was on the 29th April. It could be worse.

160529week

The Aus markets performed well generally. Again there is a, relatively, large loss. I hadn’t noticed this until I did the chart but after what happened on the greyhounds I thought I’d look into it. The events leading to the loss of £5.70 were identical to those above. The trend without this is good though.

Aus160529week

The US markets have not done too well but I am not giving up on them just yet. They haven’t traded since the loss on the dogs due to a minimum balance limit being different for the US, which I hadn’t noticed. I’m going to make some fine adjustments to the entry triggers before restarting.

US160529week

Oscar has returned

After a short holiday caused by this event, Oscar is now back at work, emotionless but committed.

Mike suggested using the Take-SP option to avoid missing trading out.

BPT commented he’d previously used Back at 1.01 and Lay at 1000 to catch the best available odds.

As a way of getting the bot going again, it was quite easy to replace the 2nd-next-best-price with 1.01 and 1000, so this is what I’ve done for now. This is only a temporary fix as the greening is still calculating one refresh behind.

As I improve the greening code, I will include the Take-SP as a last resort. I think this is better as, although the odds may be off, it is taken straight away without entering the market directly. With the code improved, the use of this should be less often anyway.

Back off hols

There’s an easier way

When I download the bet history from Betfair, the “Bet placed” data is only to the minute and I need to know to the second to have any chance of matching up with the bet entry data. This is why I’ve been testing some new code trying to handle the MyBets data which seems to come in different on each update. It’s recording some rows of data multiple times which I can’t figure out but am sure is due to the jumbled nature in which it’s received.

But then, that little voice reminded me that when I view bets on my mobile, it does include the second it was placed. So I had a look at Betfair, again, and there it is, in My bets. Easily downloadable and workable.

This is how I was getting data from Bet History –

BetHistory mins


And this is how it comes from My bets, a bit more accurate –

BetHistory secs


I’ll try matching this with my bet entry data, only problem I can see is Betfair’s time and my time being different but I might be able to offset it. Something for another day now.


Week ending 15-05-16

The UK dogs are continuing on as previous weeks. The P&L isn’t rising with Traded Volume, suggesting  improvements in other areas are needed to bring greater return.

160515week

A nice chart from Aus markets with no great losses.

Aus160515week

The US bot is still missing most markets but I haven’t managed to included a start time update yet. I’m not sure my current method of scraping is the most efficient, although if I can get it working in a fashion, it’ll be a start.

US160515week

Week Ending 08-05-16

Greyhounds traded ok but I would prefer a more consistent trend than that in the chart.

160508week

Aus horses were looking like a flat return until a late boost ended the week with a positive result.

Aus160508week

First week of US horses has seen a loss but nothing too concerning for now. The main issue is the lack of activity but this is more down to the way the US markets drift away from the start time as reported by Betfair. I’m seeing most activity early on in the racing day when the post times are still close to reality. I’ve been given a good site for start times (https://classic.ebetusa.com/racing_menus/next-race.html) that drops into excel really easy but I’m trying to figure out the best way to use this info with my bot.

US160508week

Week ending 01-05-16

Here are Oscar’s charts. The dogs have done well to return 0.079% with volume increased by over 2.5x since January. I want to start adjusting stake to matched volume as I think the effect of it’s current size on smaller markets is negative. I’ve only looked at a few examples so far, so more investigation is required.

The Aus chart is pleasing with a good return. This is in line with expectation after the percentage stake effect I mentioned last week.

160501weekAus160501week

(Sorry for chart quality, I’ve been playing around with settings. I’ll try again next time.)

Week ending 24-04-16

Last week’s charts both end positive. The UK dogs is still going good, the last week in loss was back at the beginning of January.

The Aus markets traded to a profit since being flat (excluding errors) for a month. I’d previously set the Aus stake to £2 to avoid the turnover charge and was thinking that using the same stake may make my bot stand out. Or I may be paranoid. Well I changed it to a percent of bank earlier in the week, so the stake is different most races, if only by a penny or two. I hoped this would provide some cover from bot stalkers/baiters. The proof isn’t here yet but it hasn’t had an immediate negative effect.

160424weekAus160424week