Tag Archives: Charts

£20 to £300 CHALLENGE!!!

title

I’ve set myself a challenge on the UK greyhounds to get from a starting bank of £20 to £300 in 1 year!

To avoid falling into the trap of setting a challenge and then erasing it from history when it goes pear shaped (like so many others), I kept this beauty quiet for one whole year. I think you can see where I’m going with this. Yes, success (I may have given some clues in my previous posts).

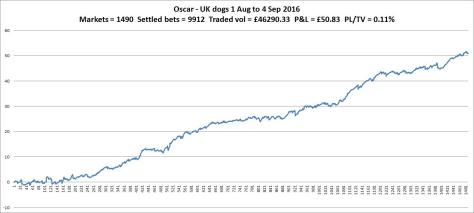
My Oscar has managed to rake in a profit of £286.57 on the UK dogs after commission. Added to the starting bank of £20, I’ve smashed the challenge target, ending with a balance of £306.57, kerching.

1-year

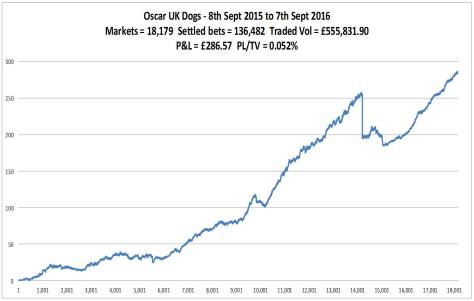
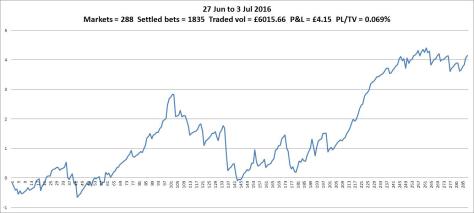
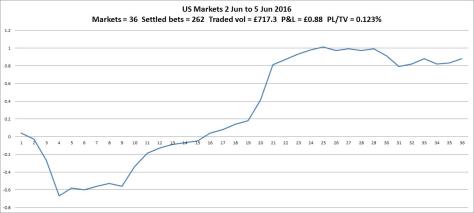
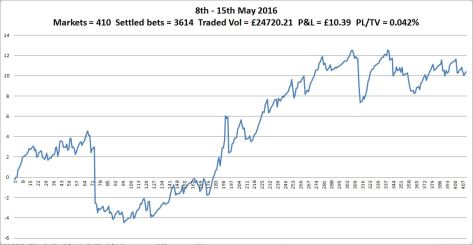
Details if chart is poor –

  • Markets traded = 18,179
  • Settled bets = 136,482
  • Traded volume = £555,831.90
  • P&L = £286.57
  • Return on traded volume = 0.052%


Weeks ending 04-09-16

Oscar (UK) has had a month of trading without me interfering and has produced another pleasant chart with a nice profit to show (0.11%).

160904

Over the same period, with an equal amount of input from me, Aus Oscar has managed a profit too, 76p. For international visitors, that’s 1.33 Aus dollar, 1.01 US Dollar, 0.91 Euro, 0.0017 Bitcoin, 0.99 Swiss Franc, etc. Still, it’s positive. The large drop was down to two lays going unmatched (Lapsed). However, I smell a technical issue as the race was due off at 08:05 but the bets were settled at 09:05. Usually Aus bets are settled within 5 minutes. Also they are the only Lapsed bets in the last 3 months. Some more digging may find the answer. And a polite email to Betfair.

Aus160904

Week ending 31-07-16

The UK dogs have produced a lovely chart and there was increased activity. I wondered if the stake size might be a reason for this (thinking it could fall between baiters) but it didn’t produce this picture of beauty when it was last at this level. I will note this current stake and come back to it if things turn bad.

160731

The Aus horses continued their choppy trend, ending positive this week. From around the 130 point I changed the entry settings (as mentioned in the previous post), restricting market participation and liability. The impact of this is inconclusive from the evidence.

Aus160731

Overall a good return, seeing enough profit to more than cover my monthly costs.

Weeks ending 24-07-16

After a slow start to the period (2 weeks), the UK dogs got into a good trend. The overall positive direction has continued from the restart in late June.

160724

The Aus markets are not doing as well. Looking back over previous charts there is noticeably more variance than on the UK dogs. I am going to respond to this by limiting the parameters before entering market. This will reduce my number of bets but hopefully increase profit (I have done a small amount of back checking to support this).

Aus160724

Week ending 10-07-16

With the UK dogs restricted to higher volume markets, activity remains low compared to previous periods. Both markets ended positive with good ratios.

If trend is kept I’ll step the UK stake up to where it was previously. Currently it is just over £3 where it had been over £7.

160710

The Aus stake has climbed around 30%, due to profit, but still well below the point that caused the turnover charge warning. That was back in February, I’d planned to code around the events where the charge is applicable but haven’t yet.

Aus160710

Week ending 03-07-16

Here are last weeks charts. Both performed well overall with similar mid week dips. The ratios are above average for both markets.

I’m going to leave the stakes as they are for now, having reduced them after previous losses. they are still a percentage of bank so will increase (or decrease) with balance.

Also, no US racing for now until I’m happy with dogs and Aus.

On a different note, these charts were produced automatically using VBA. The data is saved from Betfair in two files for each market and I’d been manually sorting, calculating and creating the chart. After a few hours learning some new techniques, I can download the P&L and History files, open the P&L and run a macro. Less than a second later and the chart is created, exported and saved in a separate file, ready for the blog. I really like automation .

160703


Aus160703

Weeks ending 26-06-16

My time is a bit limited with our new arrival (revealed here), which is why it’s been a month since my last results.

As I wasn’t keeping an eye on the bot, it went on a losing streak, hitting the minBalance level and stopped trading. Due to a coding error created after the previous error, Aus trading was also interrupted. After about a week of no trading, I finally noticed and restarted the Aus markets but left the  UK and US paused until I could look into any cause.

Having looked through all my data I can’t find any reason for the losses beyond “that’s what happens, win some, lose some”. Downward trends are to be expected as much as upward trends in the short term. I restarted the UK markets with reduced stakes at the beginning of the week. Time will tell.

160610

The trading that the Aus markets produced was below recent returns but positive.

Aus160623

I know why the US markets stopped trading before the others, the minBalance is set different and is auto adjusted periodically. However, this only auto adjusted upwards and didn’t cope with a loss just after adjustment – there wasn’t enough room to allow for regular losses and another error meant excel hit a run time error.

US160605

Weeks ending 29-05-16

These charts cover a two week period. The obvious feature in the UK chart was reported here. It was a loss of £58.51 on a losing Lay bet placed in error. The interesting thing is that for the period, the overall return only amounts to -0.078% of turnover. As a single event, it takes the greyhounds “bank” back to where it was on the 29th April. It could be worse.

160529week

The Aus markets performed well generally. Again there is a, relatively, large loss. I hadn’t noticed this until I did the chart but after what happened on the greyhounds I thought I’d look into it. The events leading to the loss of £5.70 were identical to those above. The trend without this is good though.

Aus160529week

The US markets have not done too well but I am not giving up on them just yet. They haven’t traded since the loss on the dogs due to a minimum balance limit being different for the US, which I hadn’t noticed. I’m going to make some fine adjustments to the entry triggers before restarting.

US160529week

Week ending 15-05-16

The UK dogs are continuing on as previous weeks. The P&L isn’t rising with Traded Volume, suggesting  improvements in other areas are needed to bring greater return.

160515week

A nice chart from Aus markets with no great losses.

Aus160515week

The US bot is still missing most markets but I haven’t managed to included a start time update yet. I’m not sure my current method of scraping is the most efficient, although if I can get it working in a fashion, it’ll be a start.

US160515week