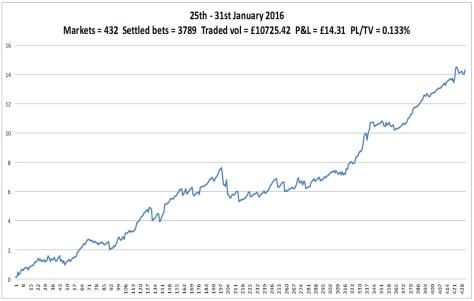
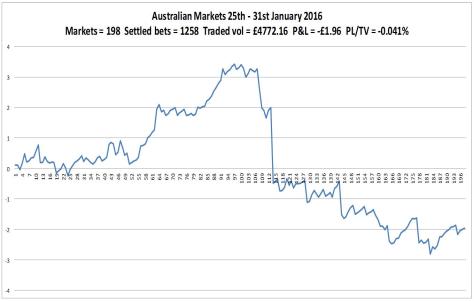
Another week and the swing from Aus to UK being more profitable has continued. The UK chart is very pleasing on the eye. The Aus chart not so. Another day was missed, Wednesday, which is quite a busy day on the Aus horses judging by the number of tweets I get from @Betfair_Aus. Apparently this is due to missing info from the Aus API when market refresh is triggered in Gruss. I must get round to adding more code to try and prevent this. The large loss was another one of those things, no errors or missed bets, just quite a few losing trades in a row on one market.
With reference to my last post about costs, Januray’s P&L was £32.97 pre costs and £17.87 after. So I achieved my goal of not being a loser.

Can you make some charts that are longer than a month (6 months or a year) to get the bigger picture?
It would be interesting to see if there are any cycles or other such features.
Thanks.
BPT – http://www.betfairprotrader.co.uk/
LikeLike
Hi
Check my latest post
LikeLike