Tag Archives: automated betting

Longview charts

As requested by Betfair Pro Trader, here are some charts.

The first is the best continuous data I could get together, covering over 6000 UK greyhound markets from 28th September 2015 to 31st January 2016. This covers a lot of changes with the settings and even trading rules such as allowing multiple open bets on one runner. (Ignore chart title, it is from 28th September)

281015 to 310116

I have mentioned before that the AUS horses ran a lot tighter on the settings and that early in January I changed the UK dogs to the same limits. So below is the period 3rd to 31st January, cut from the above chart. This period saw an increase greater than 1.5 times the previous 2 periods combined. So far this confirms the settings are now more beneficial despite my concern they may have had a negative impact on activity.

3rdTo31stJan


Week ending 31-01-16

Another week and the swing from Aus to UK being more profitable has continued. The UK chart is very pleasing on the eye. The Aus chart not so. Another day was missed, Wednesday, which is quite a busy day on the Aus horses judging by the number of tweets  I get from @Betfair_Aus. Apparently this is due to missing info from the Aus API when market refresh is triggered in Gruss. I must get round to adding more code to try and prevent this. The large loss was another one of those things, no errors or missed bets, just quite a few losing trades in a row on one market.

With reference to my last post about costs, Januray’s P&L was £32.97 pre costs and £17.87 after. So I achieved my goal of not being a loser.

160131weekAus160131week

Costs

I’ve been monitoring my computers energy use since October and on average it costs £9.10 per month to run (this includes UPS). Added to the Gruss subscription, that’s £15.10. I’ve looked into putting it on a virtual server (VPS) but it’s a bit costly at the moment. Although monthly fees for a windows setup can be found for less than £9, adding Office to be able to use Excel pushes the price up.

When my own bot is running OK, I should be able to move to a VPS, reducing my costs. There are other benefits to this, such as faster connection and better up time. Also being able to access from anywhere would be good. I could access my own computer remotely but I’m sure that would interfere with the bot’s response time. Anything I do seems to effect it, even sending a small file causes Gruss to pause.


Milestones

Well they are to me. Towards the end of last week, the total number of markets I’ve taken part in topped 40,000. I like numbers. To think my bots have monitored at least double that amount of markets is amazing.

The second point came on Sunday when my balance hit three figures. In reality it’s irrelevant but visually, it’s encouraging.

And last but not least, bring out the bunting, I’ve started coding my very own bot using Programming For Betfair. Once I started I found visual studio easy to get on with, similar to the VBA IDE but better, a lot better. It was a little annoying at first with it’s auto correct and finish features (it adds end statements automatically but I keep typing them, giving two lines of the same thing) but I’m getting used to it. Can’t wait to get it running my own algorithms, the possibilities are endless…

Big files

The data collection is working perfect and isn’t having any impact on the trading, by which I mean it isn’t slowing it down at all. I use timer to track code execution times.

The issue is file size. At the end of each day’s trading, the data is saved to a new file. These are around 150mb in size. I keep all my trading stuff in cloud storage, which has its limits (capacity). It got me thinking, firstly to store locally, secondly, how to make use of it. This takes me back to where I started with data collection- what to do with it.

It’s all about analysis. If I work out the process of analysis, find the relevant data points I need to monitor, I can perform the calculations live and save the results only, rather than everything.

Having a good few days worth of data will be useful for testing but I don’t want to have endless reams of stuff I might never go back to. So once I’ve got a couple of gigs stored, I’ll stop the collection and start the analysis.

Week ending 17-01-2016

The big story from last week was missing 3 days of trading on the AUS markets. 2 were down to software malfunction, it’s being investigated. The 3rd was a coding issue.

Sometimes it doesn’t matter how many times you test the code, step by step, forcing values in, it still gets stuck when let loose in the real world. It worked great collecting data but I reworked the process for better efficiency and missed a single line. This wouldn’t have been a problem if I’d had ‘on error resume next’ in the code but I don’t like using that if I can help it, especially when the code is new and I really want to know what the errors are. (A good place to use ‘on error resume next’ is when scraping data from a website, as any errors on the webpage could stop the program dead, even if it’s just a typo or faulty link). So when my code saves all the day’s data to a new file, it deletes it from the running bot. This left nowhere for the current events data to be stored and just hung on a runtime error. Easily fixed though.

The UK dogs produced really good results, greater than 0.1%, which I see as good. And a smoother chart than in previous weeks.

The AUS horses, as discussed, was a mild let down. The traded results were a bit more choppy than previous weeks. The large win at the end was due to a partially matched lay, this time going in my favour.

160117weekAus160117week

Test chart

I’ve been testing the data collection code and trying different ways of reading and presenting it.The chart below is an example of what can be produced from the data.

This data, from a UK greyhound race, is for one runner and covers the last two minutes of trading before the scheduled off. The blue line is the LTP (last-traded-price). The red and green lines are the WOM (weight-of-money) values on each side. On this particular chart there appears to be some connection between periods of WOM in one direction and the trend of the LTP. From the left as LTP is falling, WOM is pushing in the downward direction (red line). Then from the centre, as LTP is rising, WOM is pushing upward (green line). More testing required.

test1

Recording data

After a lot of messing about I decided to start again with the data collecting code. I’d  got to a point where there was so much going on with the array that I was hitting error after error. So I thought a fresh start was a good plan and go back to my first idea of just collecting the data for later analysis.

As mentioned previously there is a lot of data to collect. My solution is to create and name a new workSheet after a new event is selected, then record the data for that event to it’s own sheet. I wanted the sheet name to be relevant to me and as there is a limit to the number of characters that can be used, I chose the event start time as the sheet name. I grab this from the first cell as passed to excel. To prevent an error if there are two events with the same start time, my code checks to see if the sheet already exists before creating it. At the end of each day the event sheets are saved as a separate file and deleted from the bot, ready for the next day’s trading.

Another problem I came up against was how to paste an array to a sheet that isn’t active. I don’t want to activate a sheet, paste data then activate the main sheet as this is very slow. After some googling I found that, for example, .range(Cells(1, 1), Cells(10, 10)) is actually read as .range(ActiveSheet.Cells(1, 1), ActiveSheet.Cells(10, 10)). So I replaced the “ActiveSheet” bit with the sheet name I wanted. It works.

I want to do some more testing before I make this live as I’ve only tested on some Betdaq markets.

I’m also planning on adding a page to the blog to put code examples for different problems as I spend too much time searching for things I’ve used before but can’t remember. It might help others too.

Week ending 10-01-16

After the previous week ended with a loss due to an error, I wasn’t expecting much last week but was surprised with the outcome. I changed the settings on the UK dogs to the same as the Aus horses. I expected a difference in the trading but not this. Here’s the chart for the last two weeks, showing the loss and then the events afterwards.

01 2 week

I could tell a story about how I’d programmed a recovery process to be performed after an unpredictable loss. That’s not the case though. From the point of the loss, an almost constant winning streak happens until the position is recovered to the common trend, followed by results I would expect with the tighter settings in place. I can’t explain this other than a massive coincidence. I keep seeing peaks and troughs in the chart and think it strange how these results are spread out, sharp gains followed by sharp losses or vice versa, almost like I’m riding the actions of other bots. Not sure, I tend to think this is just how it is and trying to make too much out of it will lead nowhere.

Anyway, beyond that, the UK chart is otherwise slightly better than previous weeks. The AUS chart is below previous weeks but not too far so no tweaking is needed.

Work on data collection has moved a little, recording is ok but analysis/formulas need work.

160110weekAus160110week

Week ending 03-01-16

I spent as much time as I could working on the data collection idea but it wasn’t as straight forward as I’d hoped. Not because of the coding, it was the working out what I wanted to do bit that exercised my mind. So collecting data in an array and then storing (printing to an excel sheet) selected parts from around trades is something I can do. But the amount of data is quite large. For instance, if I want to store data from 10 seconds before a trade to 10 seconds after, refreshing at 0.2 secs, will give 100 data sets. Sometimes the out trade can happen 30 seconds or more later – 200+ data sets. And to have a full view of the market, that’s 1200 rows (if printing one line to a row) for UK dogs (6 runners). Some events can have 40 or more bets placed so thousands of rows for one race.

The next thing I thought was “what am I actually going to do with this data?” Well, perform calculations on it to give indications of movement, highs, lows and quantities prior/post trade, I guess. Here’s my solution – collect data in array; perform calculations on data in array; only print out results to sheet. Cracked it. But what calculations? Oh dear, I’m down the road of calculus, a subject I’ve worked with in the past and something I should have remembered more of than I have. I am enjoying this, not despite the challenge but because of the challenge. May take longer than a few evenings.

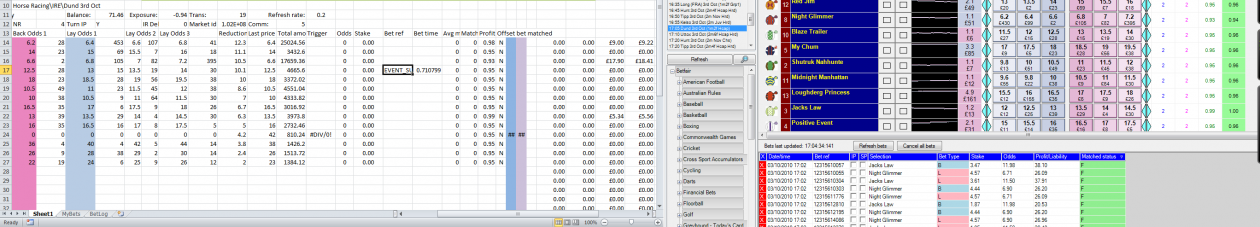
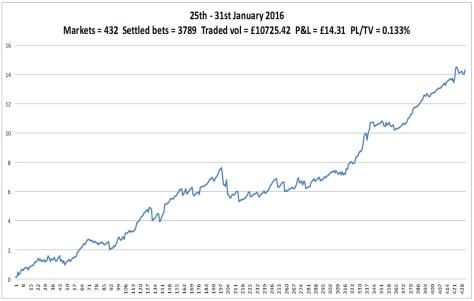
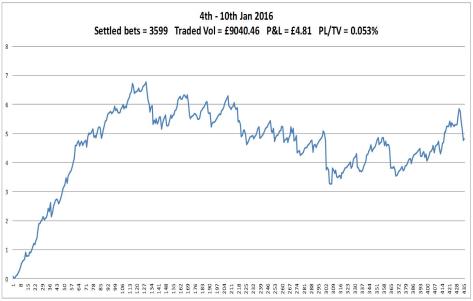
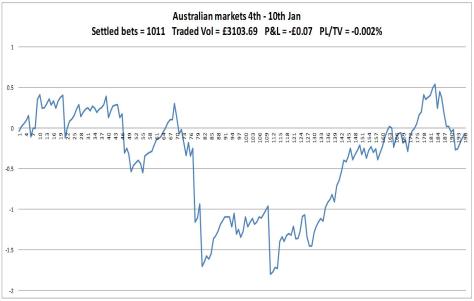
On to the charts. UK dogs not doing too bad until a big loss. This started as a rogue lay bet placed by the software, no explanation why. My bot has three goes at trading out before the off with more unfavourable odds each attempt. The third attempt went unmatched at market suspension, leaving me exposed on one runner, now known as the winner. This is a steamroller event, however as it didn’t wipe my bank, I’m thinking of it more as a wacker plate event. These things happen. Occurring on Saturday afternoon, this went unnoticed by me until the evening, so trading  had stopped. I looked into it but forgot to restart the link and then missed AUS trading on Sunday. Fixed this Sunday and have now set UK dogs to AUS settings to see what happens.

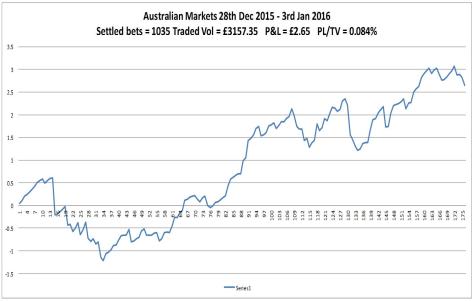
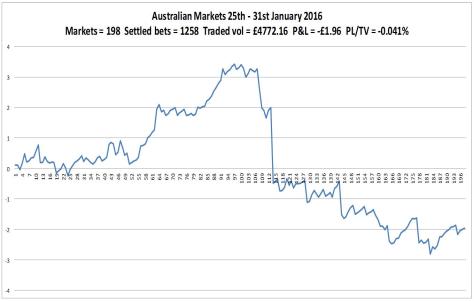
AUS chart is on trend with previous weeks, the increased activity is probably due to Christmas.

160103week

Aus160103week